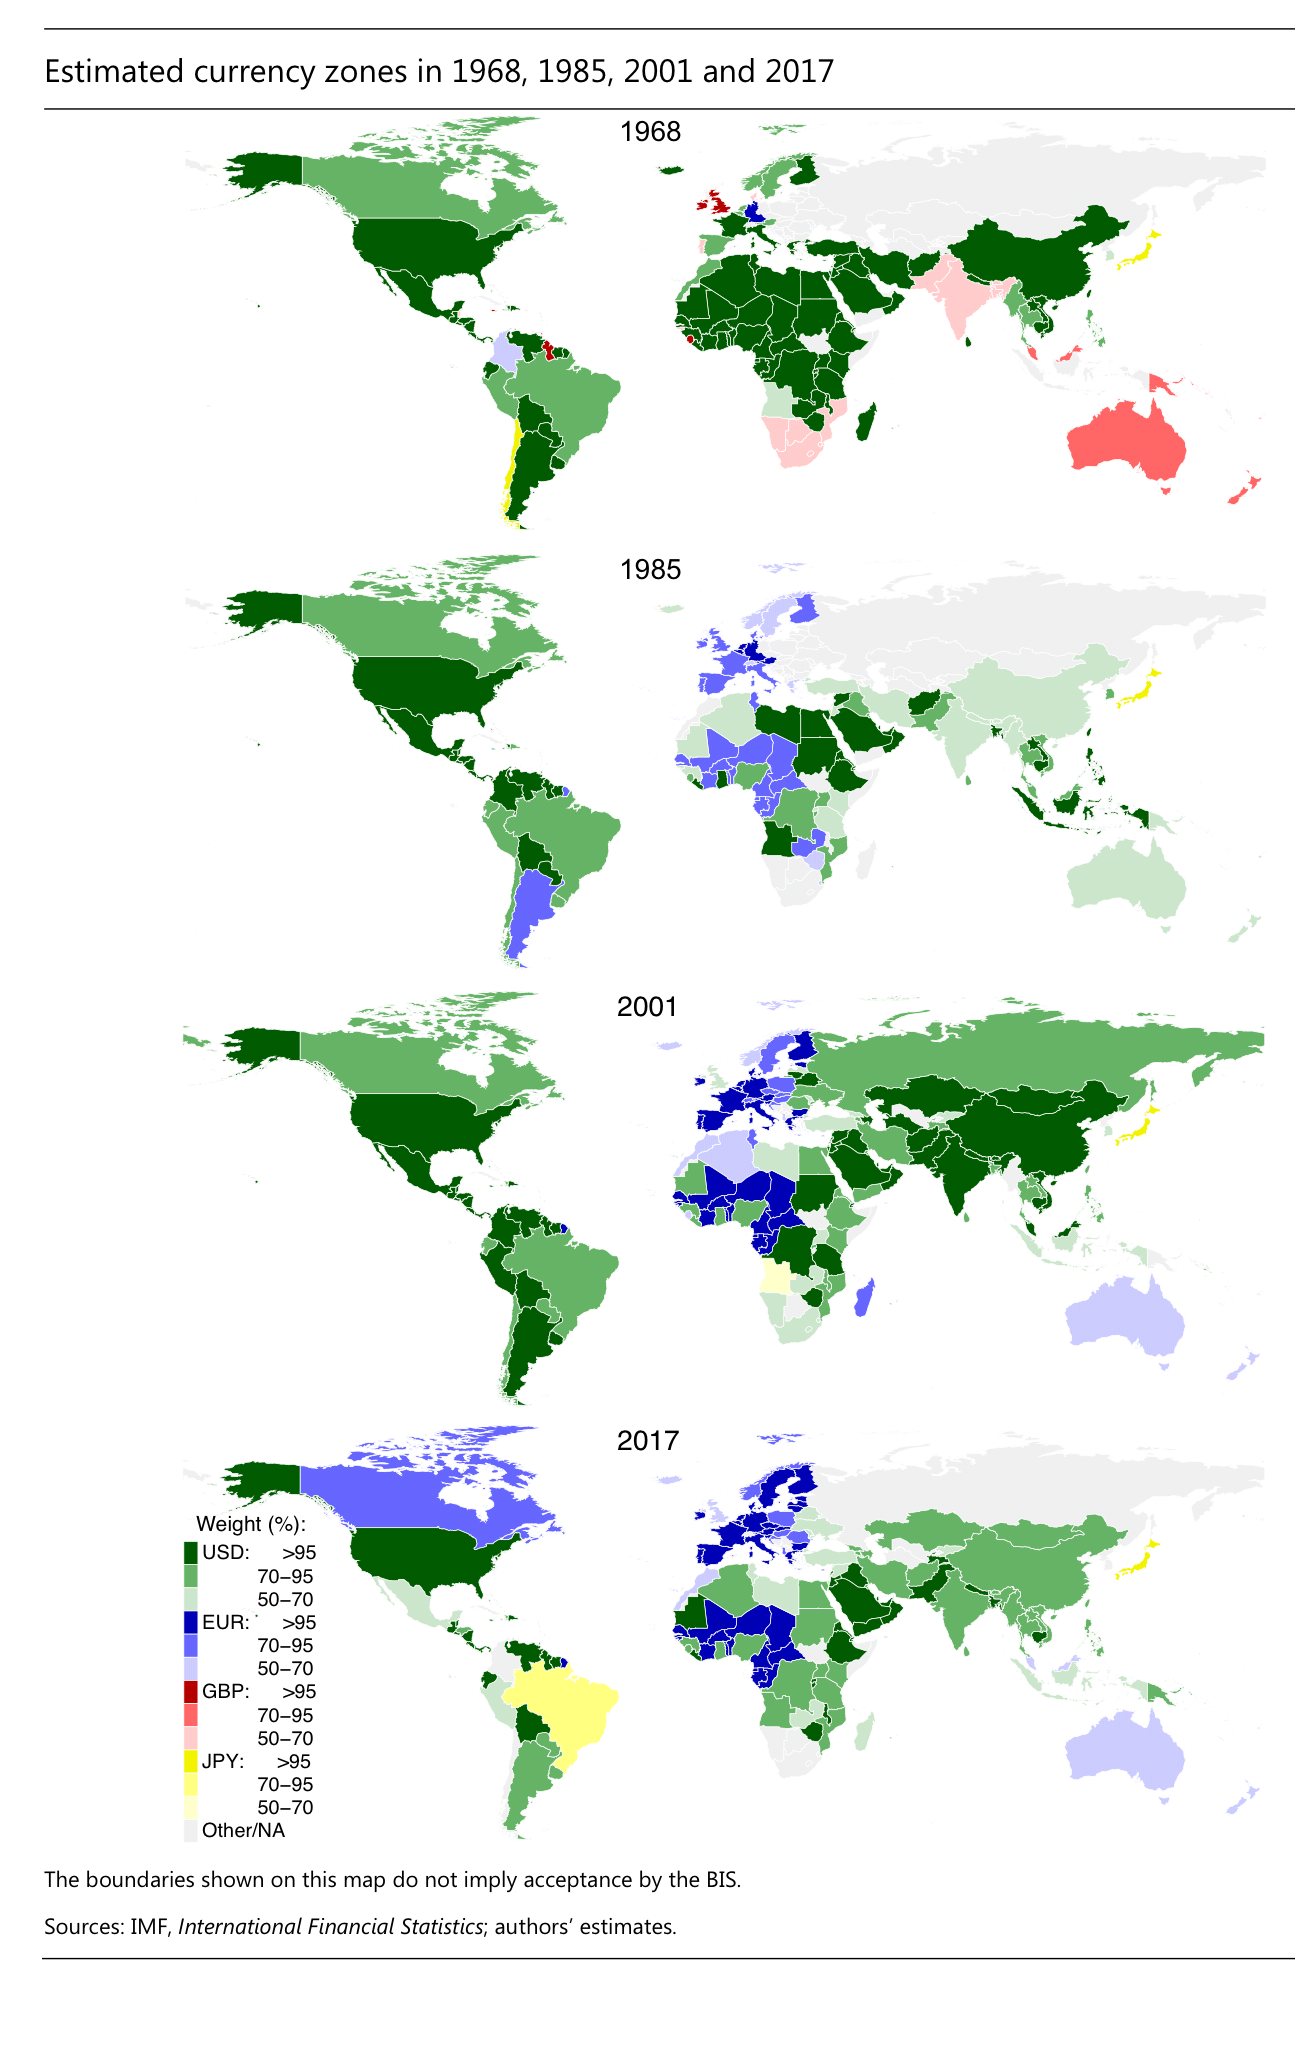
The figure above is from a recent BIS working paper “A key currency view of global imbalances“. It shows the currency geography as of four dates from the last days of Bretton Woods until now: 1968, 1985, 2001 and 2017.
The researchers estimated how much each currency co-moves with the US dollar, the euro (or the Deutsche mark (DM) before the euro’s introduction in 19991), the Japanese yen and the British pound, and use data to produce the figure above. The researchers mentioned three notable changes over time in currency geography.
1) The sterling zone disappeared in the 1970s. The top panel shows that mostly only Commonwealth countries in shades of red followed sterling’s 1967 devaluation. By the mid-1970s, the sterling zone had shrunk to little more than the United Kingdom.
2) The Deutsche mark and then the eurozone solidified its hold in Western Europe and spread eastward in the 1990s and 2000s. For example, Czech crown and Polish zloty moved to floating exchange rate, their economies integrated with the euro area, and their monetary policies reacted to the ECB’s, they joined the eurozone. The Russian rouble may be on the same pat
3) Starting in the late 1990s, the commodity currencies tended to move the dollar zone to a more intermediate position between the dollar and the euro. It could be that the euro’s introduction enlarged the DM zone, and thereby enhanced the euro’s influence on commodity prices and thus on commodity currencies
EconReporter is an independent journalism project striving to provide top-notch coverage on everything related to economics and the global economy.
💡 Follow us on Bluesky and Substack for our latest updates.💡


