Last Updated:
The research “Prospects for Inflation in a High Pressure Economy: Is the Phillips Curve Dead or is It Just Hibernating?“, by Peter Hooper, Frederic S. Mishkin and Amir Sufi is a high-profile working paper which brings the discussion of Phillips Curve back.
The paper was recently presented in the Chicago Booth School Monetary Policy Forum, and it was commented by two top-rank Fed officials, Mary Daly of the Federal Reserve Bank of San Francisco and John Williams of the Federal Reserve Bank of New York.
The story that the paper put forward is controversial enough, though. The three economists agree with the prevailing consensus that the Phillips Curve of the US is flattened in the last few decades. However, they dispute the idea that the Phillips Curve is dead.
Accelerating inflation will come if the unemployment rate goes lower than the natural for an extended period, the economists argue. The crucial reason is that the Phillips Curve is in fact a curve, rather than a linear line.
Here is the story presented by Hooper, Mishkin and Sufi. The slope of the Phillips Curve is flat. According to their own calculation, the slope of a price Phillips Curve, for a unit change in the unemployment gap, is about -0.14.
The above result is generated from the data between 1961 to 2018. If we focus on the last three decades, using only the data from 1988 to 2018, the slope of the price Phillips Curve drop to -0.037. This is the evidence for a flattened Phillips Curve.
Nonetheless, the economists went on and ask, if we treat the Phillips Curve as a curve rather than a straight line, would it change the result? First, they need to prove that the Phillips Curve is non-linear. That is, at different levels of unemployment, the slopes of the Phillips Curve are different.
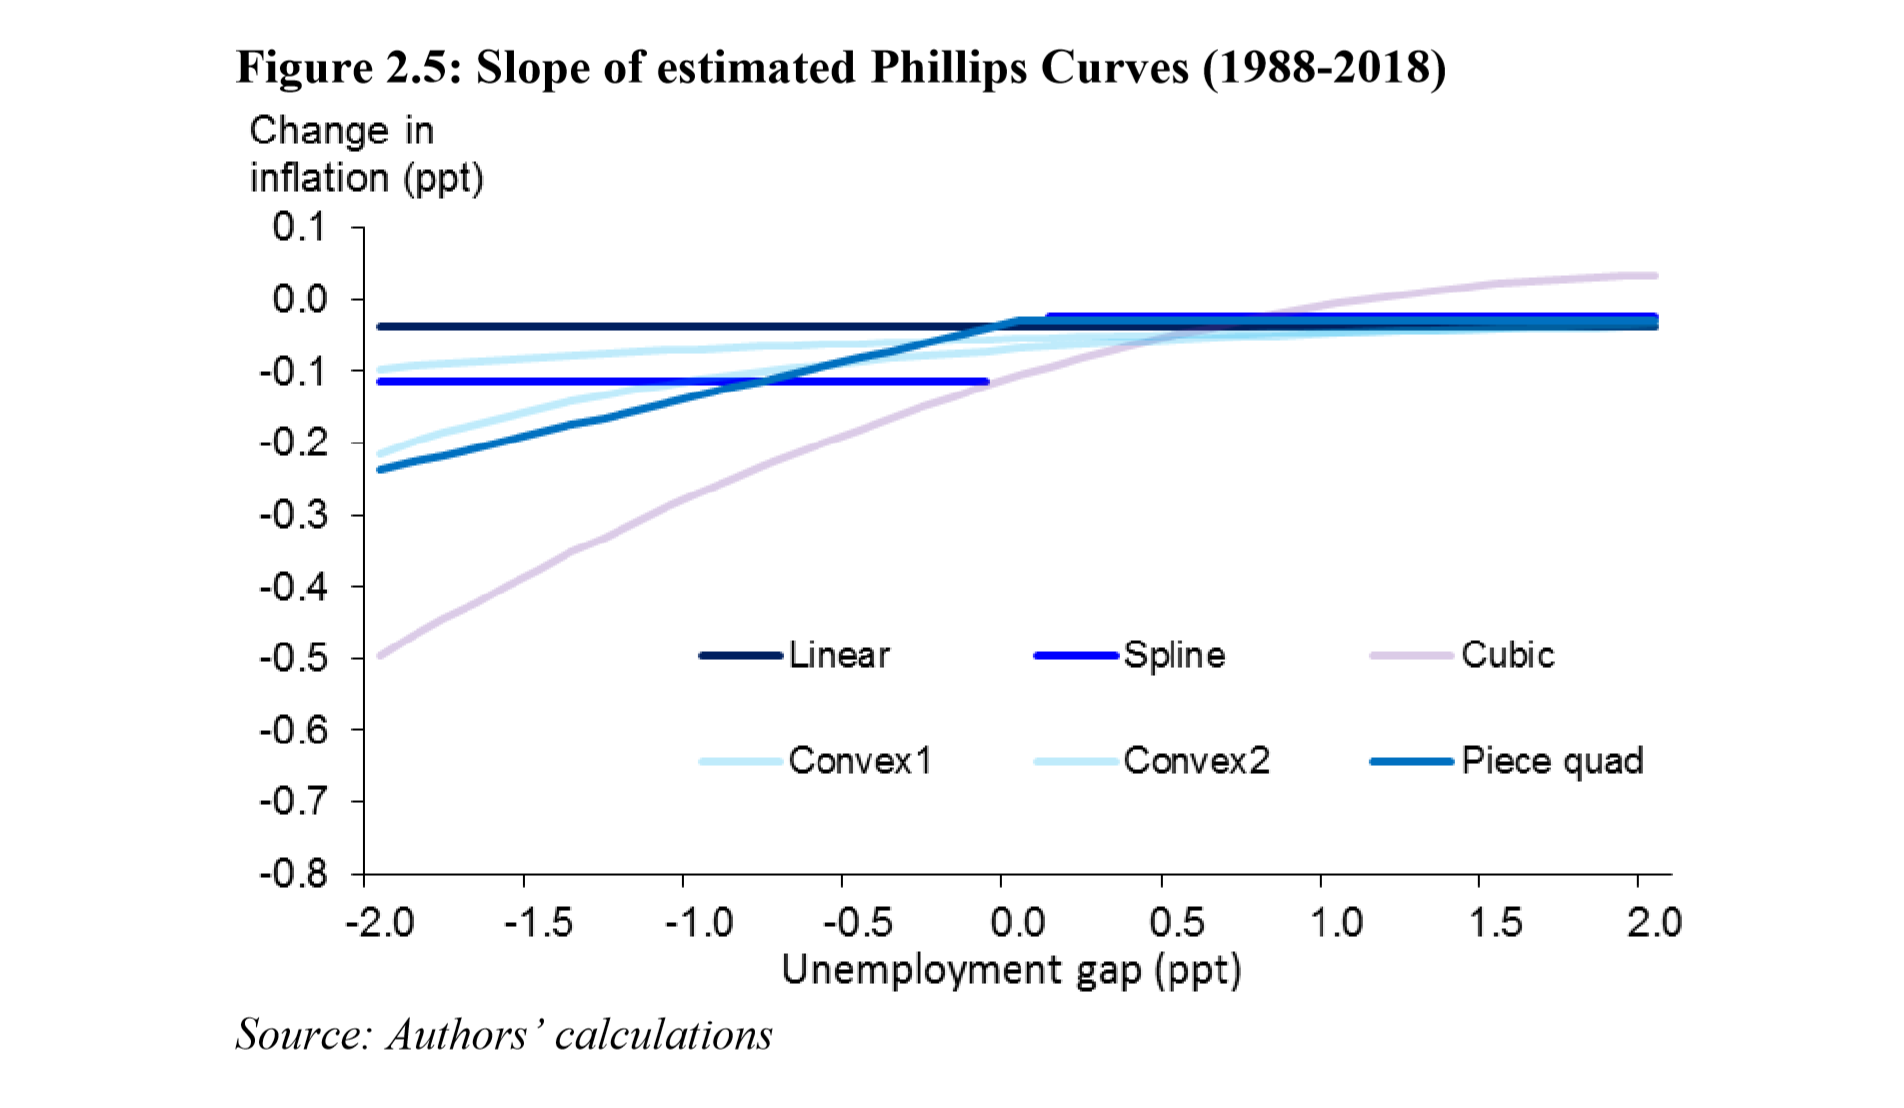
Here are Hooper et al.’s estimations:
A major result is the “Spline” setting where the economists separate two Phillips Curve, one with the unemployment gap above zero, and one below zero. Unemployment gap is defined as the realized unemployment rate minus the estimated NAIRU, by the way.
As you can see from the graph above, the slope of the Phillips Curve is -0.048 when the unemployment gap is above zero. It is flatter than the linear Phillips Curve. When the unemployment gap is below zero, the slope is much steeper at -0.423. That is, if the labor market tightened to an “overheat” level, the inflation rate would accelerate.
Does this prove that the Phillips Curve is not dead? Not so fast…
When the economists again focus on the data of the last three decades, they find not only that the slope of Philips Curve is flattened, as mentioned above, but also that the non-linearity is no longer statistically significant.
How do the economists reconcile all these findings? Here is one of the explanations:
“One possible explanation of why we don’t find a steep Phillips curve with nonlinearities in the more recent data is that economic up-cycles have become more muted over time, so there has been too little variability in the data to pick up a more normal Phillips curve in the national data.”
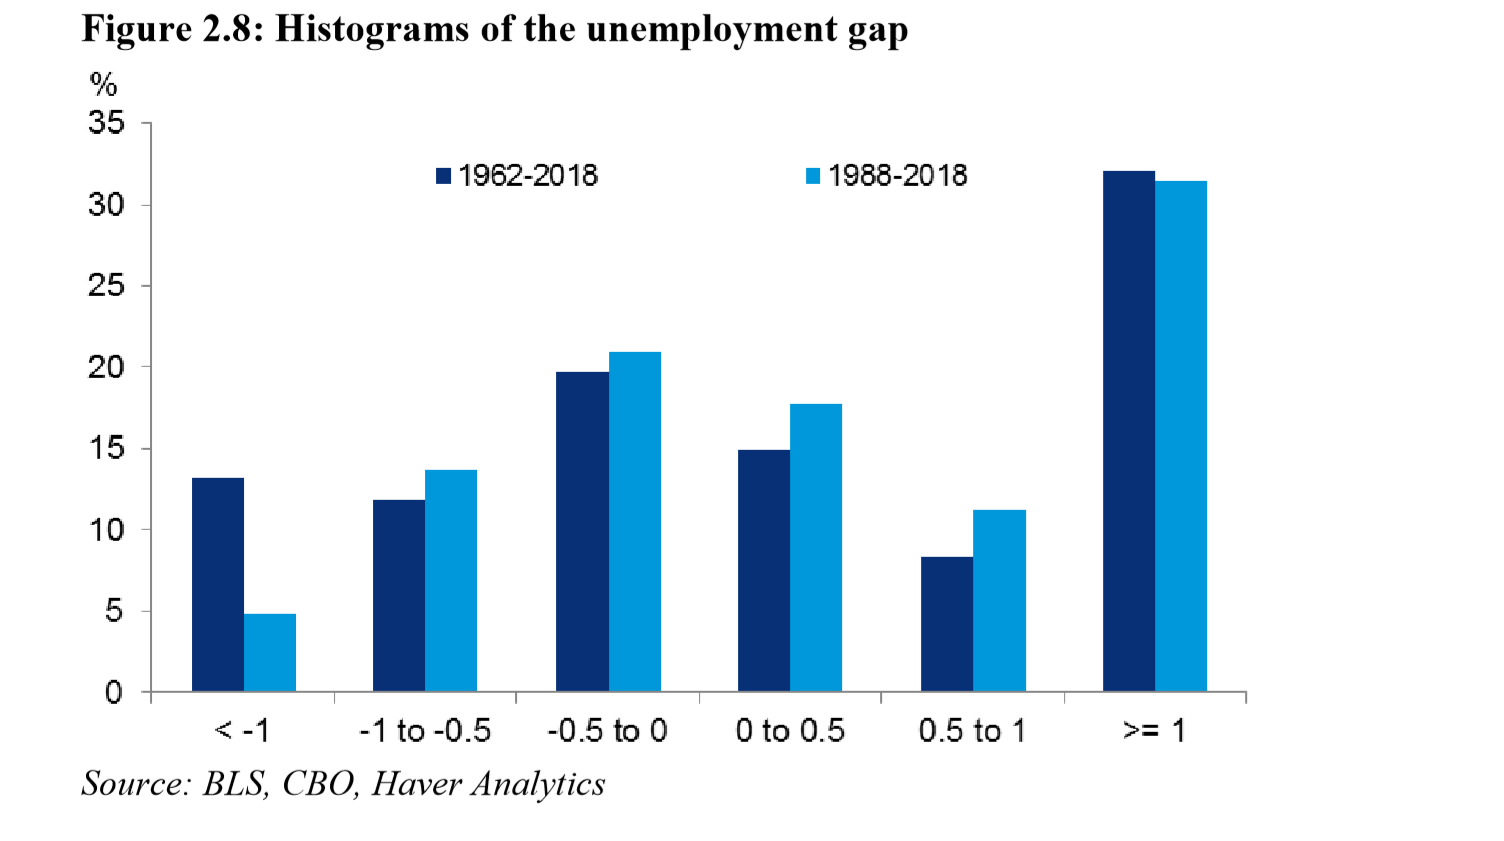
As shown in the figure below, the amount of time that the unemployment gap drops below 0 is relatively little. After 1988, the unemployment gap seldom falls below -1. Because there are so few observations where the unemployment gap below -1, it would be very difficult to estimate the nonlinearity in the Phillips curve slope in the last few decades.
If this is the case, the remedy is to find more data points. Hence, Hooper et al. turn to state-level inflation and unemployment data. At the national level, between 1980 and 2017, the unemployment rate rarely fall below 4%; at the state-level, around 15% of the observations have an unemployment rate below 4%. This provide an opportunity to test their theory.
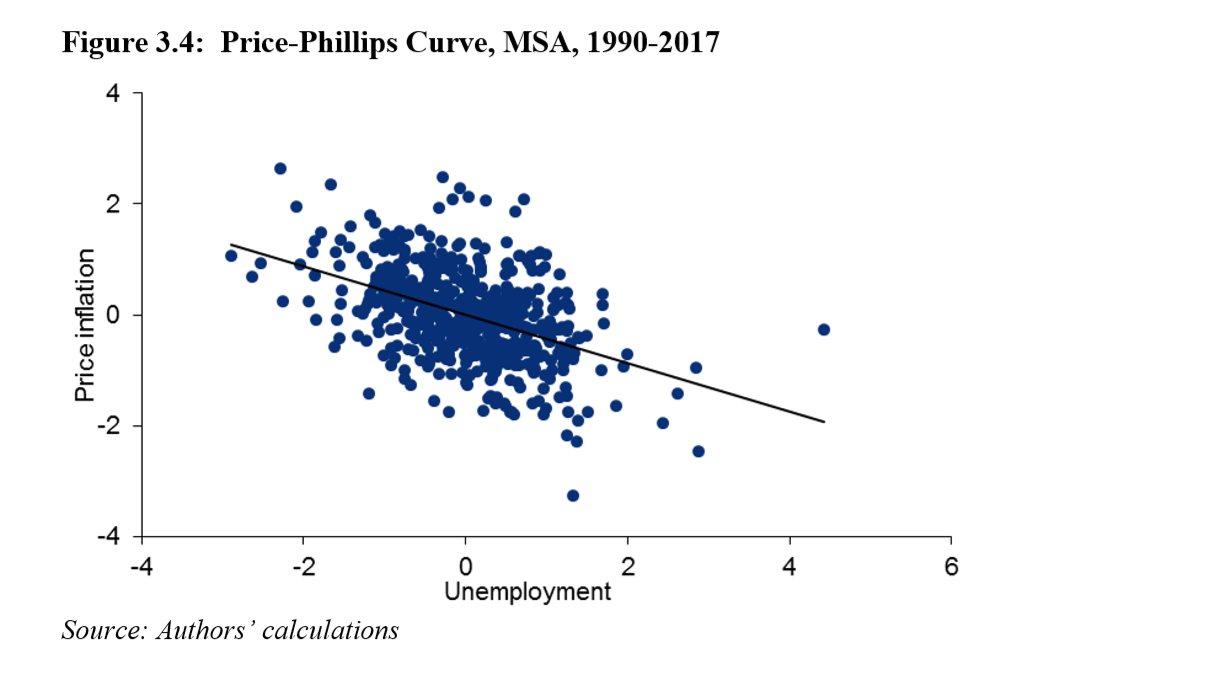
Here is the result:
The estimated slope of the Phillips Curve, on the unemployment rate, instead of the unemployment gap, is -0.44. The state level he state-level specification cannot focus on the unemployment gap, because no natural rate of unemployment estimates are available at the state level.
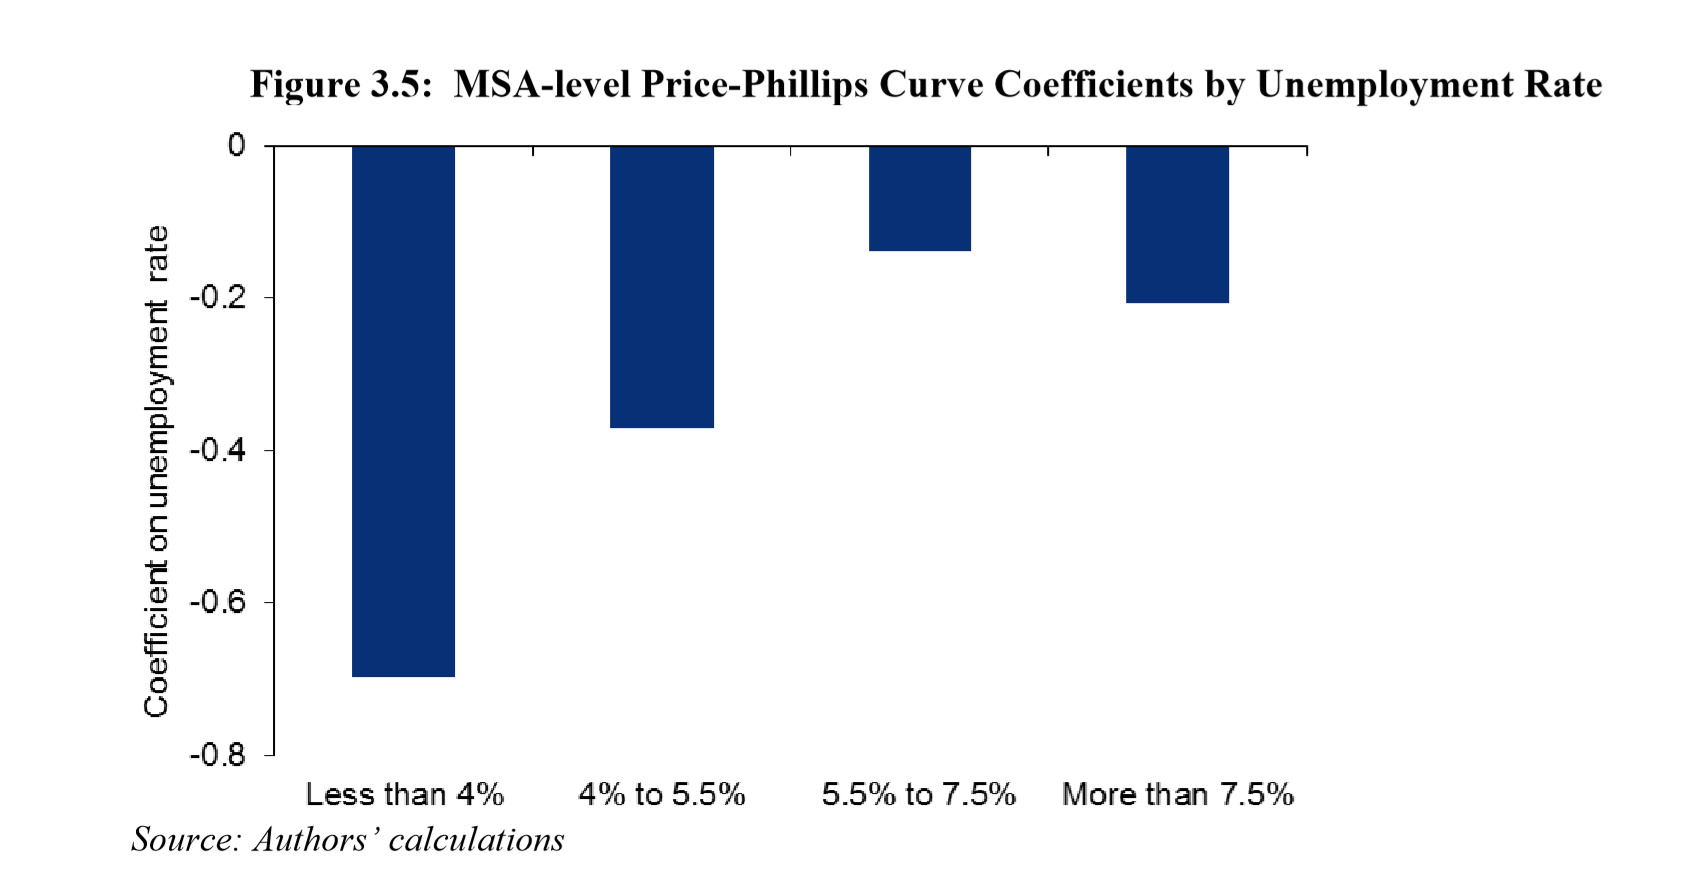
To test the non-linearity, they separate the data into several bins of the unemployment rate, for the unemployment rate below 4%, between 4 and 5.5%, between 5.5 and 7.5%, and above 7.5%.
As you can see from above, the slope of the state level Phillips curve is substantially more negative when the unemployment rate is below 4%. It flattens considerably when moving into the 4 to 5.5% bin, and then flattens further for unemployment rates above 5.5%.
So, according to this story, the reason that the Phillips Curve appears to be flattened is because the unemployment rate seldom fall to a level that is “too low”. Hooper et al. further argue that the Fed’s active monetary policy, which aim for inflation stabilization, prevented the economy from “overheating”. The Fed would raise the Fed Fund Rate when it thinks the inflation is rising above 2%, and this restraints the unemployment gap from falling below -1%.
As the argument goes, given the fact that the unemployment rate in the US is around the 50-year low, there is the danger that the unemployment gap fall to a low level and wake the Phillips Curve; that, eventually, would create an accelerating inflation.
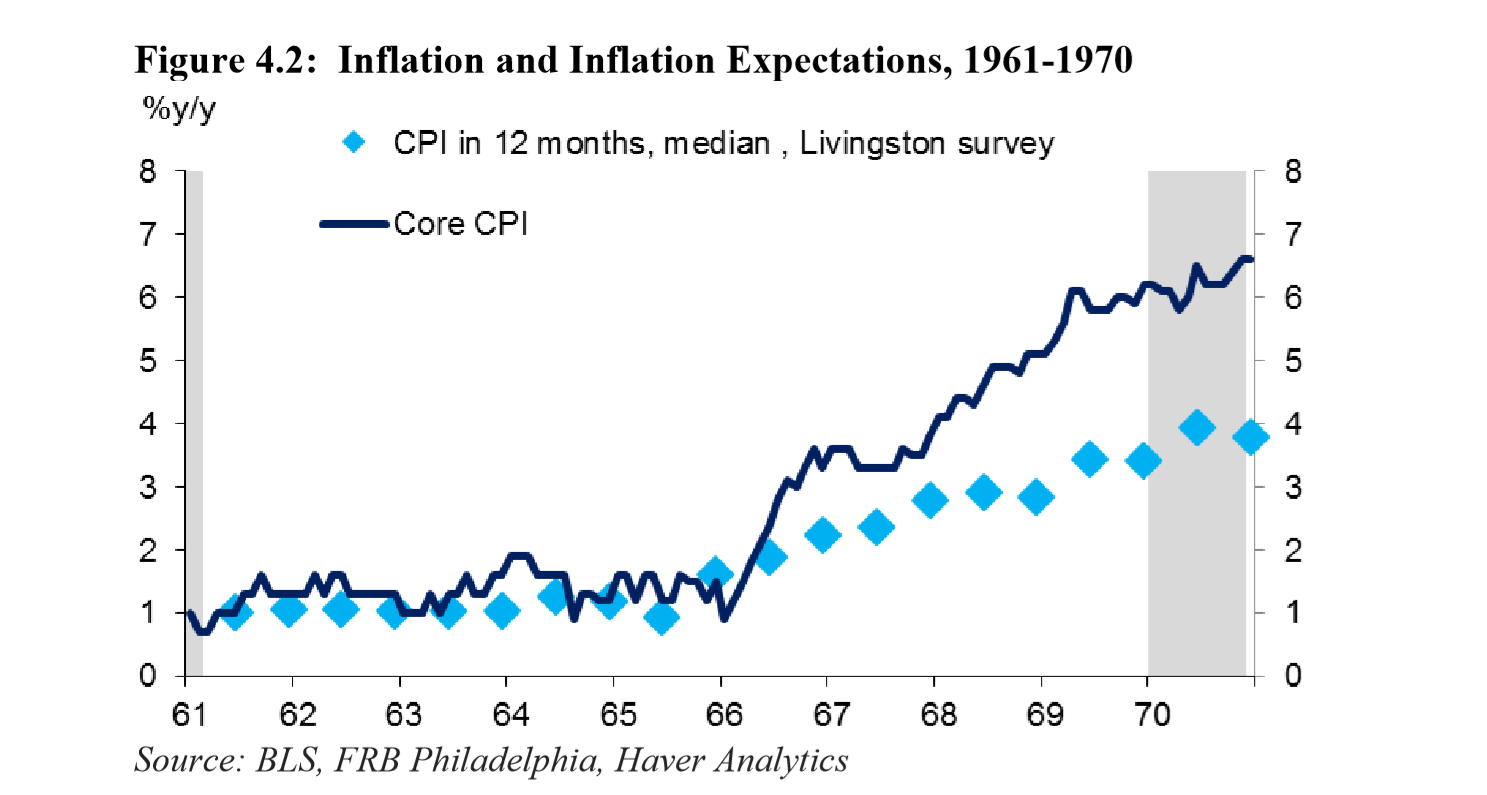
A case in point is the 1960s, when the Fed was “behind the curve” and allowed the unemployment gap fall to -2%, as it was under political pressure from the administration. The inflation rate shot up to above 6% by the end of 1960s.
So, here is the story about the importance of the non-linearity of the Phillips Curve. Let’s close with the authors’ conclusion:
“…our analysis not about whether inflation will rise in the near future, but rather that the Fed should not be complacent about inflationary pressures. As we have discussed, the flattening of the Phillips curve in recent decades reflects some combination of the absence of very tight labor markets, the endogeneity bias of monetary policy, and the anchoring of inflation expectations. Monetary policy committed to stabilizing inflation has been central to all three of these factors. A departure from this policy would likely lead to a steepening of the Phillips curve.”
EconReporter is an independent journalism project striving to provide top-notch coverage on everything related to economics and the global economy.
💡 Follow us on Bluesky and Substack for our latest updates.💡


