Last Updated:
Is there any “predictable” pattern following housing “bubbles”?
To answer this question, Byron Tsang of Virginia Tech and Xiaojin Sun of University of Texas at El Paso examined the house prices of 50 states (plus the District of Columbia) as well as 402 metropolitan statistical areas in the U.S. over the past 40 years.
A “bubble” episode is defined as a run-up in cumulative real housing return of 15% or more over the previous year as well as at least 20% or more over the past four years.
One of the significant finding is that a bubble episode usually predicts positive returns for about two further years, but negative returns after that.
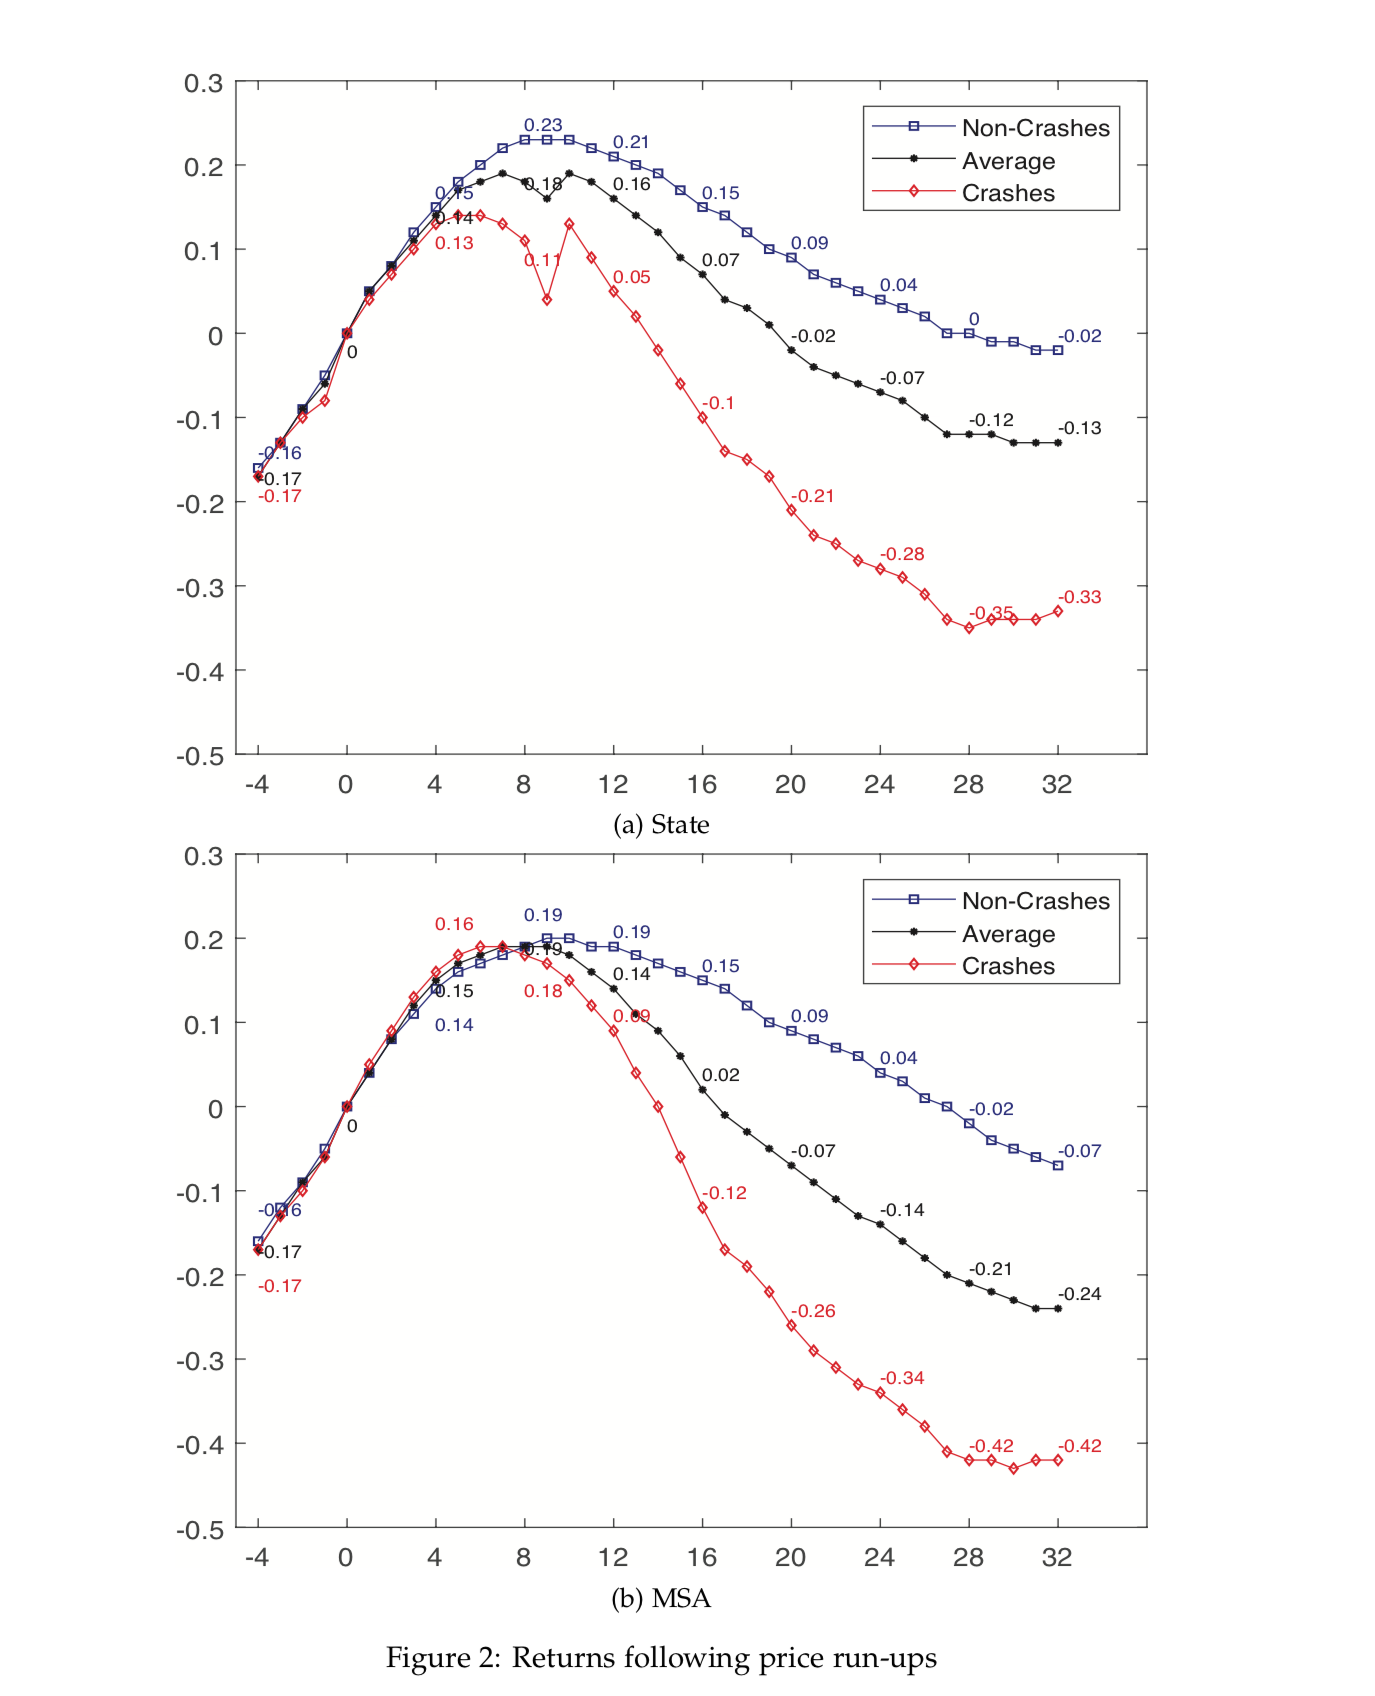
Black line in the figure below plots the average return in housing prices after the “run-up” episodes, for states and metropolitan statistical areas (MSA) respectively. As shown in the graph, a rapid rise in housing prices may not be followed by a crash, at least not immediately. A potential crash happen only after two years, on average.
The two researchers further separated the post-run-up price movements into “crashes” and “non-crashes”— a crash is defined as an episode of 20% or more drop in real house prices beginning at any point after a “bubble” was identified.
For those episodes that ended with a crash, house prices start to drop after the first year; whereas, in cases that didn’t end up in crashes, prices continued to go up for one more year.
Eventually, prices fall with or without a crash, just that the extent of decrease is larger in “crashes”.
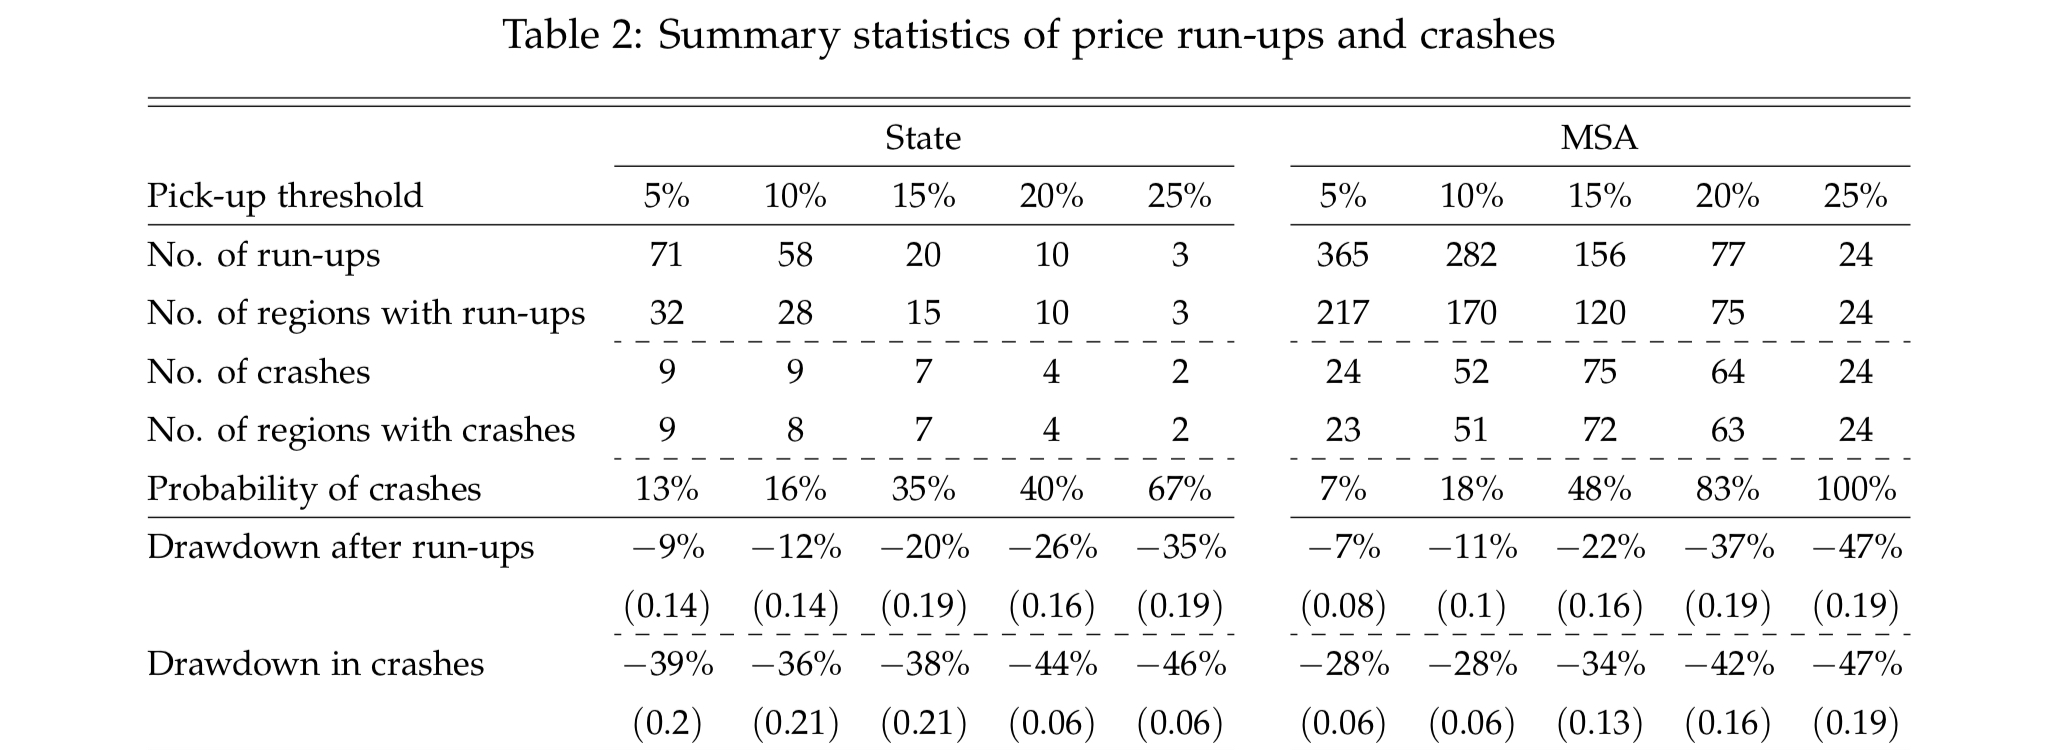
The study also look into the probability of a “crash” following a “run-up” in housing prices.
The results suggest that a sharp increase in real house prices would lead to a substantially higher probability of crash.
At the state level, the probability of a crash following a 5% annual price run-up was only 13%. The probability increased rapidly to 35% when the annual run-up was 15%. The probability shoot up further to 67% if the annual run-up was 25%. A similar pattern was found on MSA-level data.
How much the house prices would fall is also proportional with the size of the “bubble”, in general.
The average fall in price following a 5% annual price run-up was only 9%, at the state level, and, 7% at the MSA level; but 20% and 22% fall, respectively, could be expected following an annual run-up of 15%.
The size of the crash would be increase to 35% and 47% following an annual “bubble” run-up of 25%!
“Large Price Movements in Housing Markets” (Byron Tsang, Xiaojin Sun), Journal of Economic Behavior and Organization, 2019, vol. 163, 1-23.
EconReporter is an independent journalism project striving to provide top-notch coverage on everything related to economics and the global economy.
💡 Follow us on Bluesky and Substack for our latest updates.💡


