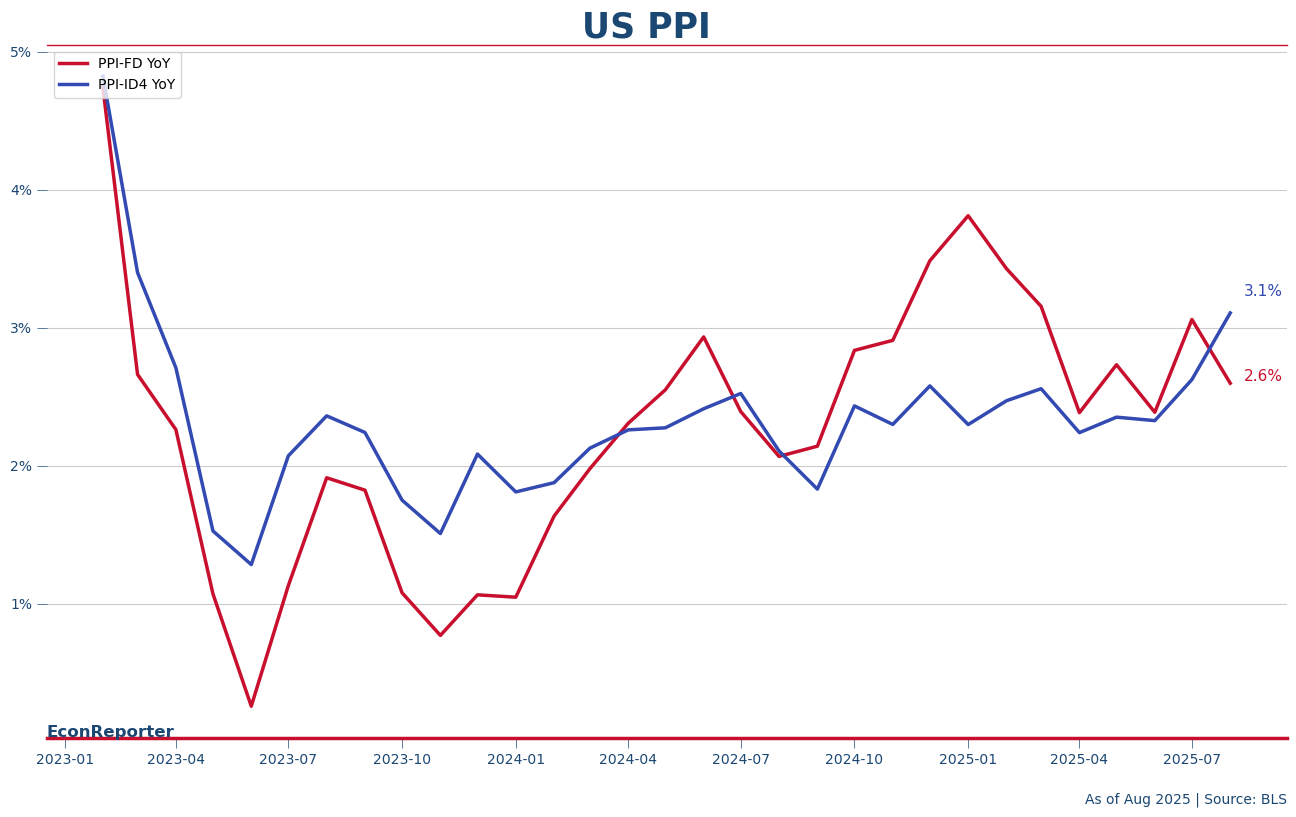
The Producer Price Index for Final Demand (PPI-FD) declined 0.1% MoM in Aug, bring the annual increase down to 2.6% from 3.1% in the previous month.
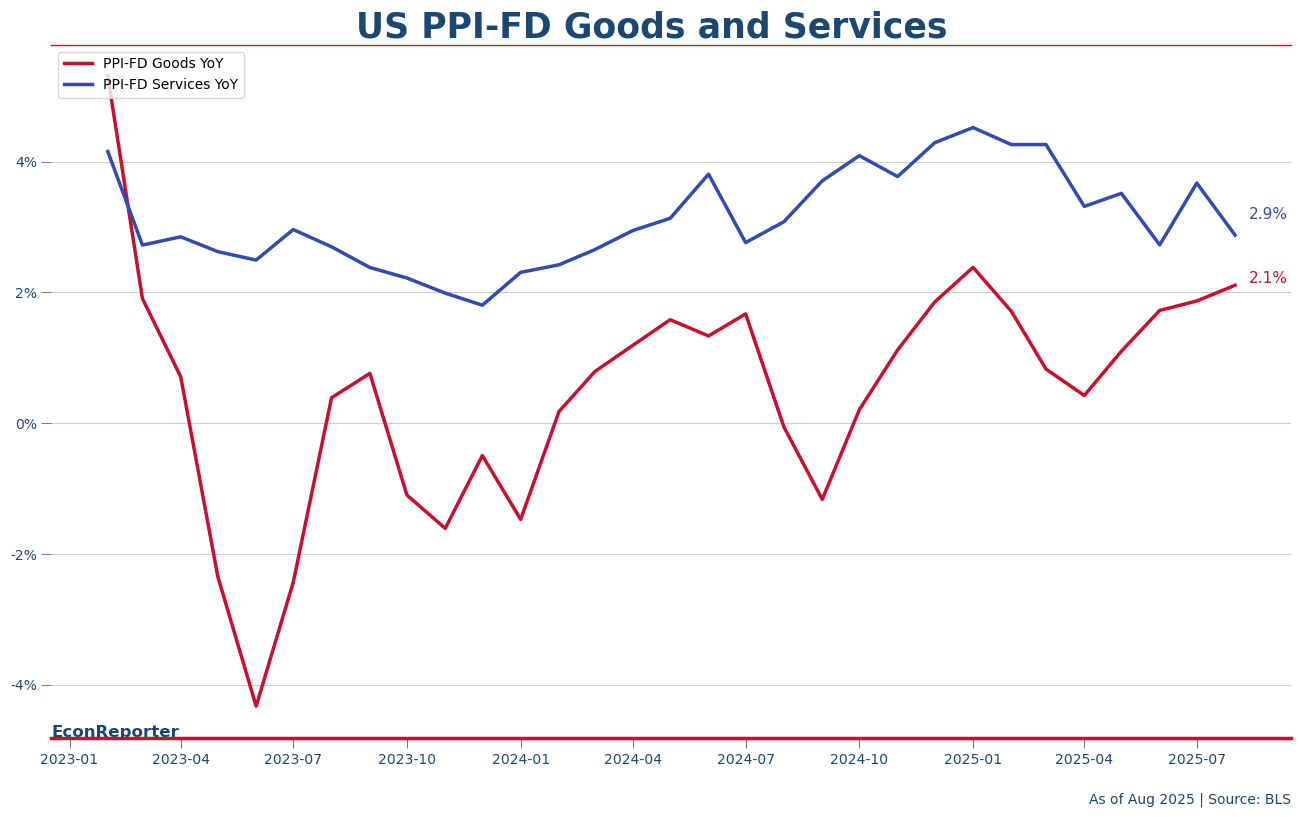
The deceleration in producer price inflation — for final demand, which count the prices for ready to consume goods and services — was driven mostly by a slowdown in service producer prices as the PPI for final demand services fell 0.24% MoM. This brought its YoY growth down sharply to 2.9% from 3.8% in the prior month.
In contrast, PPI for final demand goods continued to accelerate, rising from July’s 1.9% YoY growth rate to the 2.1% in August. The upward trend was even more pronounced for core goods (which excludes foods and energy prices), , where the YoY growth rate climbed further to 2.9%, from 2.7% in July.
Trade Margin ‘Squeeze’ Clouds Overall Picture
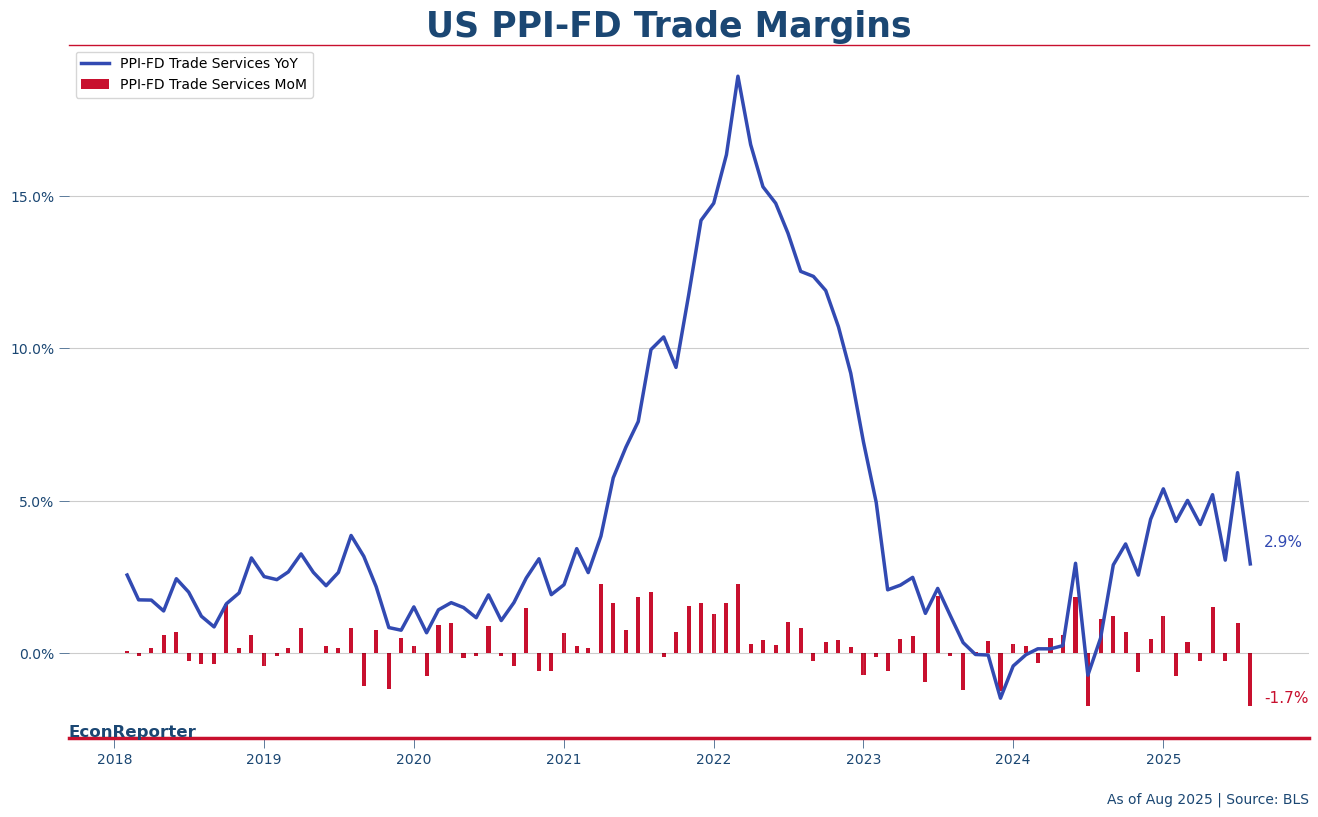
What is behind the PPI service price inflation slowdown? It can be attributed to a 1.7% MoM decrease in trade services index. Trade services is a catch-all category for wholesale and retail services and this category measures the price margins for wholesalers and retailers— essentially, the difference between a product’s selling price and its acquisition cost.
The trade service prices have been a focal point for analyzing the impact of tariffs. Assuming tariff costs push up the acquisition prices wholesaler and retailers pay — as BLS doesn’t exclude tariff expenses in their acquisition price collection — when the margins decrease it would be interpreted as “tariff squeezing margin”; when the margins increase, the conclusion would likely be “retailers are passing costs to consumers.”
While both narratives are sensible when used separately, rapid swing of the trade services PPI in recent month have led to conflicting interpretations from one month to the next, making it difficult to form a clear picture.
Looking at the YoY growth rate of trade service PPI, provides a clearer, if still volatile, trend: Trade service price growth has remained at an elevated level compared to the pre-2020 and 2023-2024 periods.
It is reasonable then to conclude that there are obviously some kinds of tariff pass-through, so the margin growth is not depressed so far; Still, the month-to-month volatility indicates that wholesalers and retailers may be undecided on how to handle the extra cost brought by the Trump administration’s trade policy.
Cost Pressures Build in Service Productions
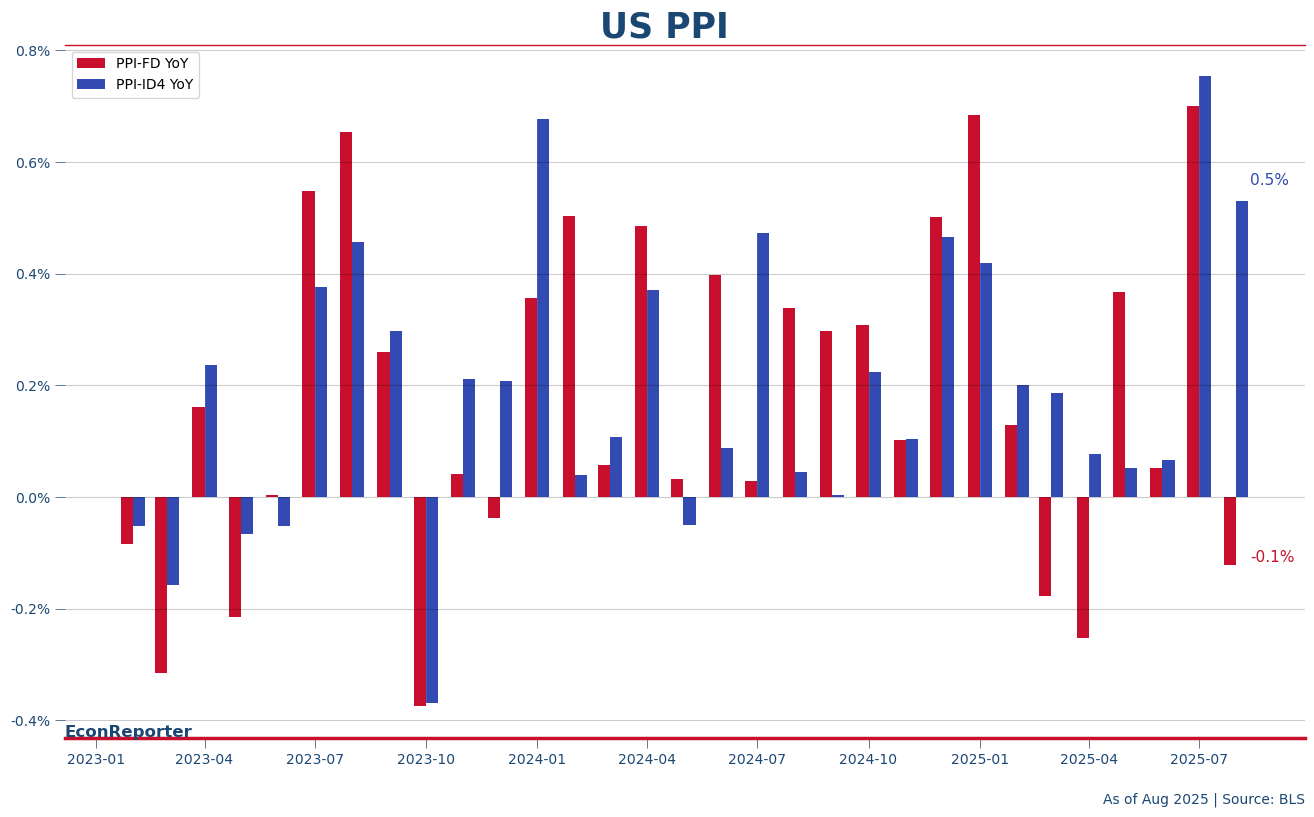
Looking beyond Final Demand figures also reveal further inflation pressures. In the PPI system, Stage 4 Intermediate Demand measures the prices of inputs producers used to make their “final” products or services that are ready for consumption and the PPI for Stage 4 Intermediate Demand (ID4) show a notable increase in price pressure are coming through the pipeline.
The overall ID4 index increased 0.5% MoM in August, a sharp contrast to the Final Demand index’s 0.1% drop.
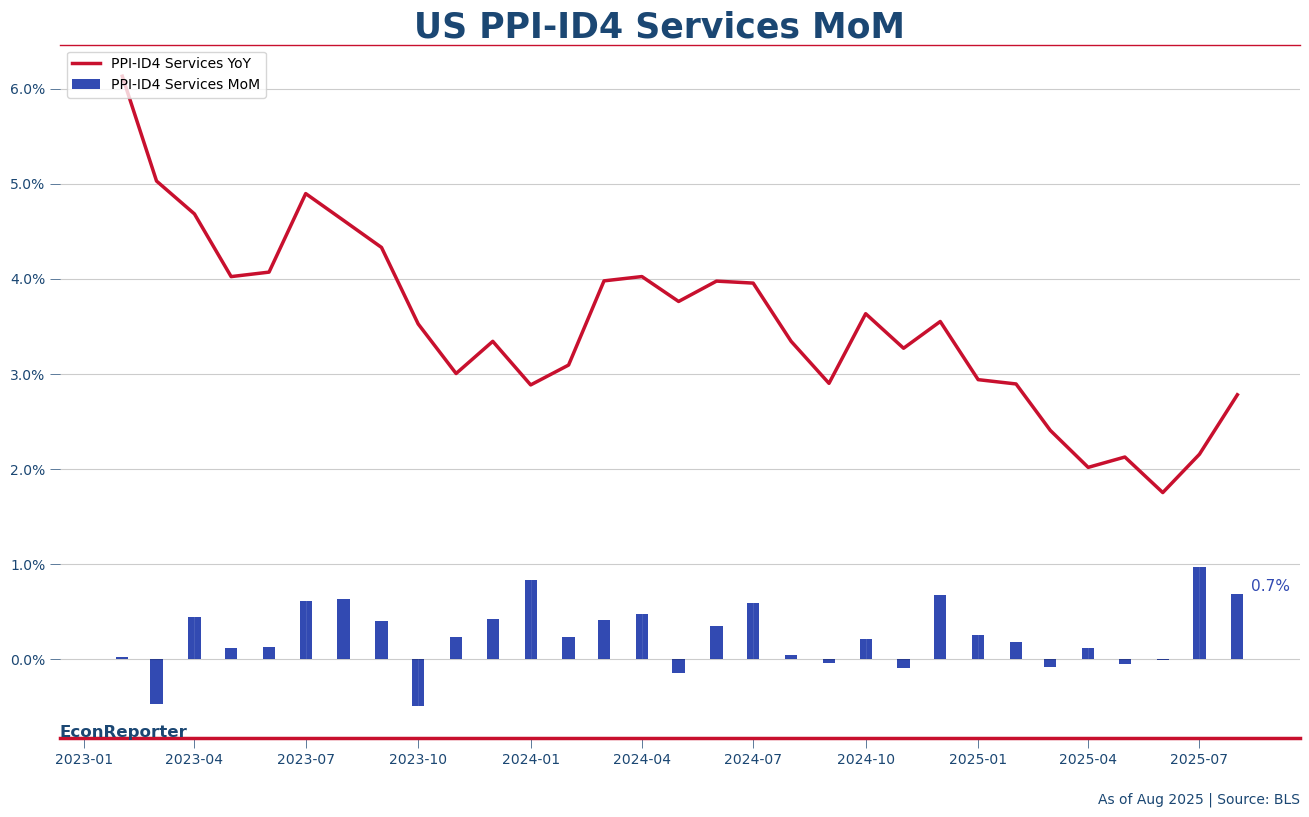
For stage 4 goods and construction producers, the input prices rose 0.4% and 0.3% MoM, respectively. The most notable one, nonetheless, is the input prices to stage 4 service producers, which saw a 0.7% MoM increase in the month.
This trend is particularly concerning as it aligns with recent CPI and PCE data showing a revival in consumer service inflation, suggesting that service providers are facing—and may soon pass on—increasing costs.
Ultimately, while the August PPI report offers a surface-level reprieve, a deeper look reveals a relative complex picture. The headline slowdown was driven by volatile trade service margins and a significant build-up of cost pressures is still in the production pipeline for services.
EconReporter is an independent journalism project striving to provide top-notch coverage on everything related to economics and the global economy.
💡 Follow us on Bluesky and Substack for our latest updates.💡


