To pull data from BLS’s API, we first will need to import several python packages, including Json, Matplotlib, Requests and Pandas. If the packages are not already installed, you can always use the Pip method to install them.
import requests
import json
import matplotlib.pyplot as plt
import pandas as pd
BLS provides API Python Sample Codes on their website. Here is how we can edit those codes to retrieve headline and core CPI time series for the period between 2023 and 2024 in Json format.
# Set the headers and data for the API request
headers = {'Content-type': 'application/json'}
data = json.dumps({
"seriesid": ['CUSR0000SA0', 'CUUR0000SA0L1E'],
"startyear": "2023",
"endyear": "2024"
})

# Send the request to the BLS API
json_data = requests.post('https://api.bls.gov/publicAPI/v2/timeseries/data/', data=data, headers=headers).json()
Here, an important question is how do we get the series IDs for the data you need. The short answer is through BLS’s Data Finder.
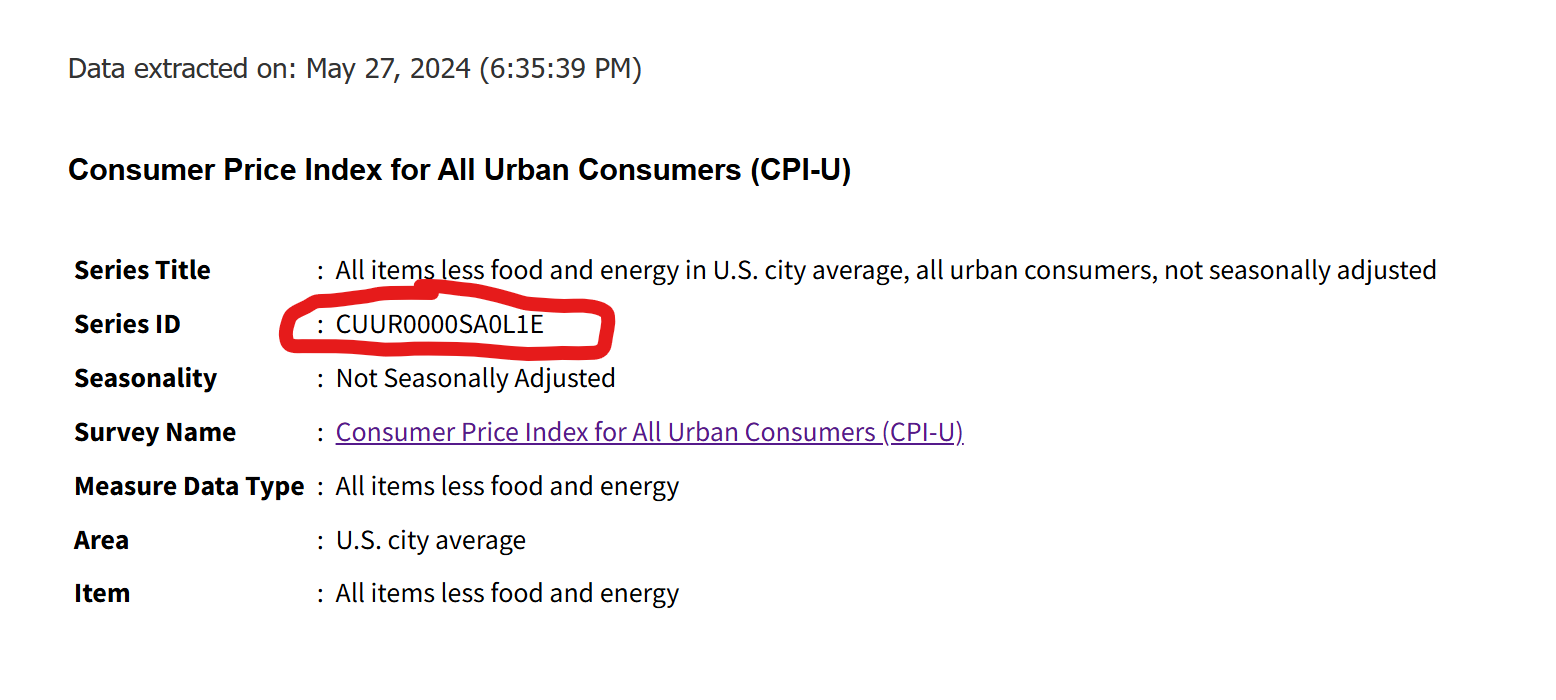
We can, for example, click on “Consumer Price Index – All Urban Consumers” below the SURVEY sub-header on the left and then input further keywords for the series you want. Inputting “less food and energy” in the search bar, we would easily see “All items less food and energy in U.S. city average, all urban consumers, not seasonally adjusted” series in the results. Inside the data series page, we can get the series ID, which is “CUUR0000SA0L1E“, as shown in the picture below.
We can also find the data page for Headline CPI here and the series ID is “CUUR0000SAS4“.
Then, we can parse the data series and put them into a DataFrame with these codes:
# Parse the data and prepare for DataFrame
data_list = []
for series in json_data['Results']['series']:
seriesId = series['seriesID']
for item in series['data']:
data_list.append({
'Series ID': seriesId,
'Year': int(item['year']),
'Month': item['period'],
'value': float(item['value'])
})

# Create the DataFrame
df = pd.DataFrame(data_list)
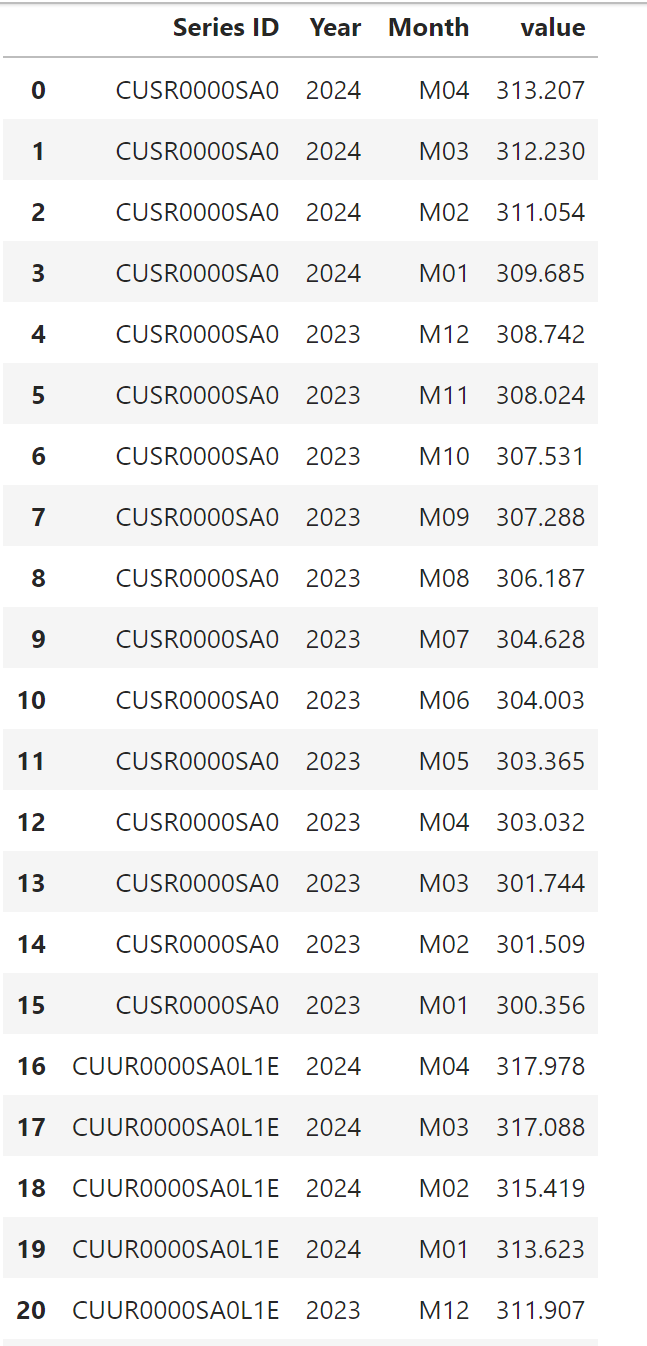
Use display(df) to check the content of the dataframe, which is like this:

These are the first 20 rows of the dataframe. The codes above limited the number of columns to just four, which include Series ID, Year, Month and Value, and that’s all that we require to plot line charts or a bar charts for the data series.
Before we move on to plot a graph, here are some additional editing we can do to simplify the graph making process. First, combine the month and year columns as “Date” column and set it as the index of the dataframe:
from datetime import datetime

df['Date'] = df['Year'].astype(str) + df['Month']
df.index = df['Date'].apply(lambda x: datetime.strptime(x, '%YM%m'))
Please note that we have to first import datetime to perform this steps.
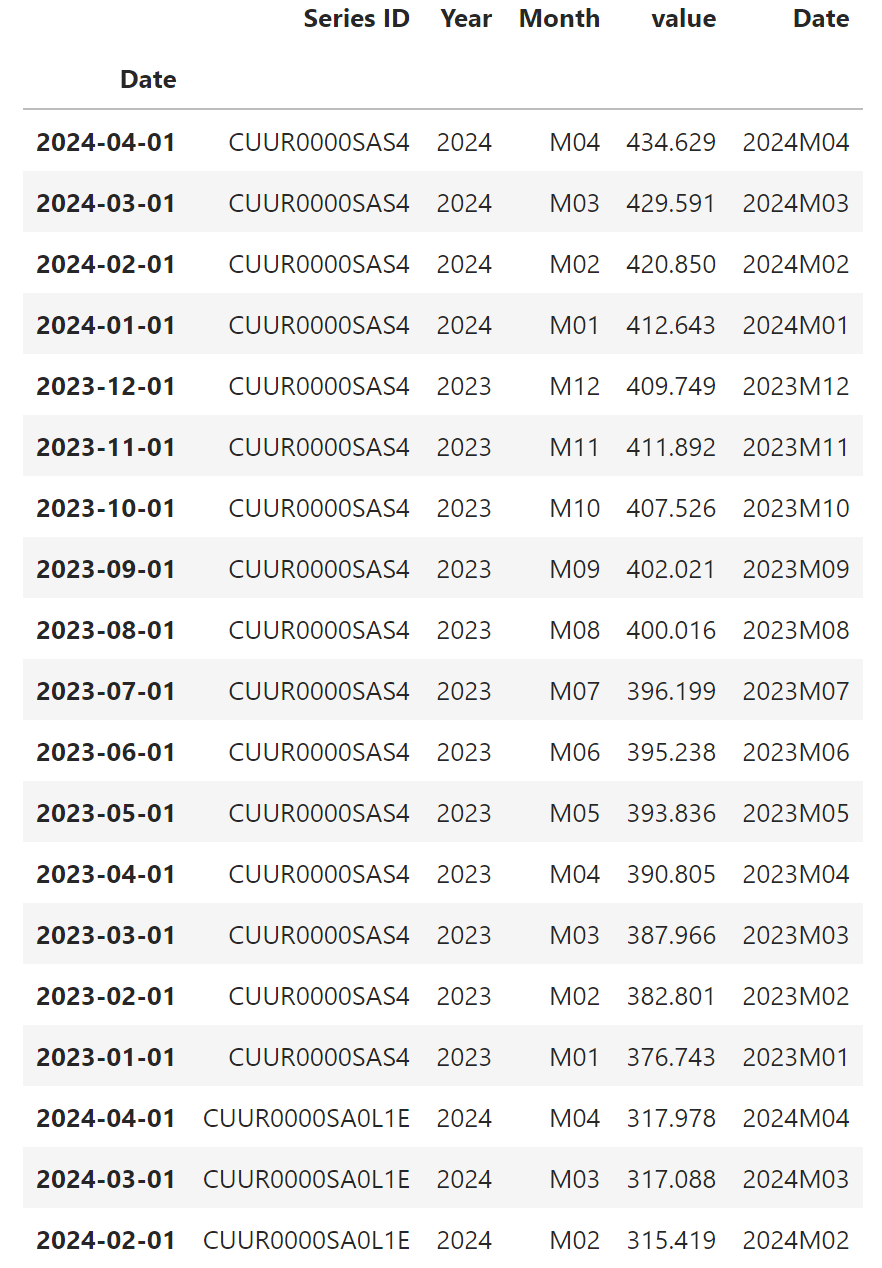
Use the display function to check the new dataframe, which should look like this, with the date as the dataframe index:
Now, say we want to plot a line chart for CPI inflation.
We have to first sort above dataframe to display the series chronologically, from earliest to latest, so that Python can compute the inflation growth rates correctly.
df.sort_index(inplace=True)
Then create a separate dataframe that contains only the all item CPI series:
df_cpi = df[(df['Series ID'] == 'CUSR0000SA0')]
After that we can ask python to calculate the monthly growth rate, cpi_m, for headline CPI:
cpi_m = df_cpi['value'].pct_change(periods=1)*100
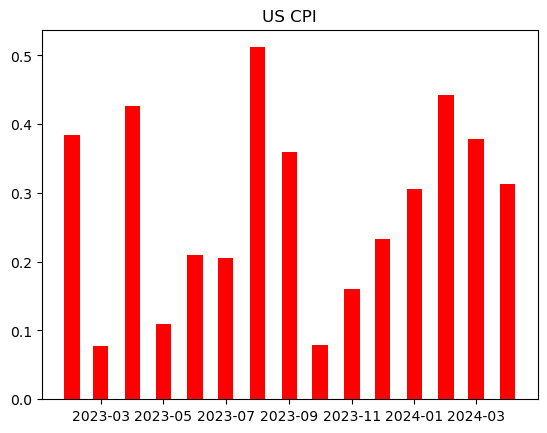
Here is the program’s output of the month-over-month CPI inflation rate:
Date
2023-01-01 NaN
2023-02-01 0.383878
2023-03-01 0.077941
2023-04-01 0.426852
2023-05-01 0.109889
2023-06-01 0.210308
2023-07-01 0.205590
2023-08-01 0.511772
2023-09-01 0.359584
2023-10-01 0.079079
2023-11-01 0.160309
2023-12-01 0.233099
2024-01-01 0.305433
2024-02-01 0.442062
2024-03-01 0.378069
2024-04-01 0.312910
Name: value, dtype: float64
With three more lines of codes below, Matplotlib would then plot a bar chart with the MoM data:
plt.title("US CPI")
plt.bar(cpi_m.index, cpi_m, color="red", label="CPI MoM", width=15)
plt.show()
So, the above is an example of how to generate a simple graph of US CPI monthly growth rate. We can also create a CPI yearly growth rate plot simply changing two of the steps above:
1) Use the non-seasonally adjusted CPI data (CUUR0000SA0) to replace all the “CUSR0000SA0” series ID we have used above.
2) After creating a CPI only dataframe, use 12 periods instead of one in the .pct_change(periods=1)*100 calculation.
EconReporter is an independent journalism project striving to provide top-notch coverage on everything related to economics and the global economy.
💡 Follow us on Bluesky and Substack for our latest updates.💡


