Last Updated:
In a recent study “Bank Equity and Banking Crises” by Matthew Baron (of Cornell University), Emil Verner (MIT Sloan), and Wei Xiong (Princeton University), the three economists developed a comprehensive database of bank equity prices and banking crises with a full-sample of 46 countries from 1870-2016. They try to understand the dynamic between bank equity decline and banking crises.
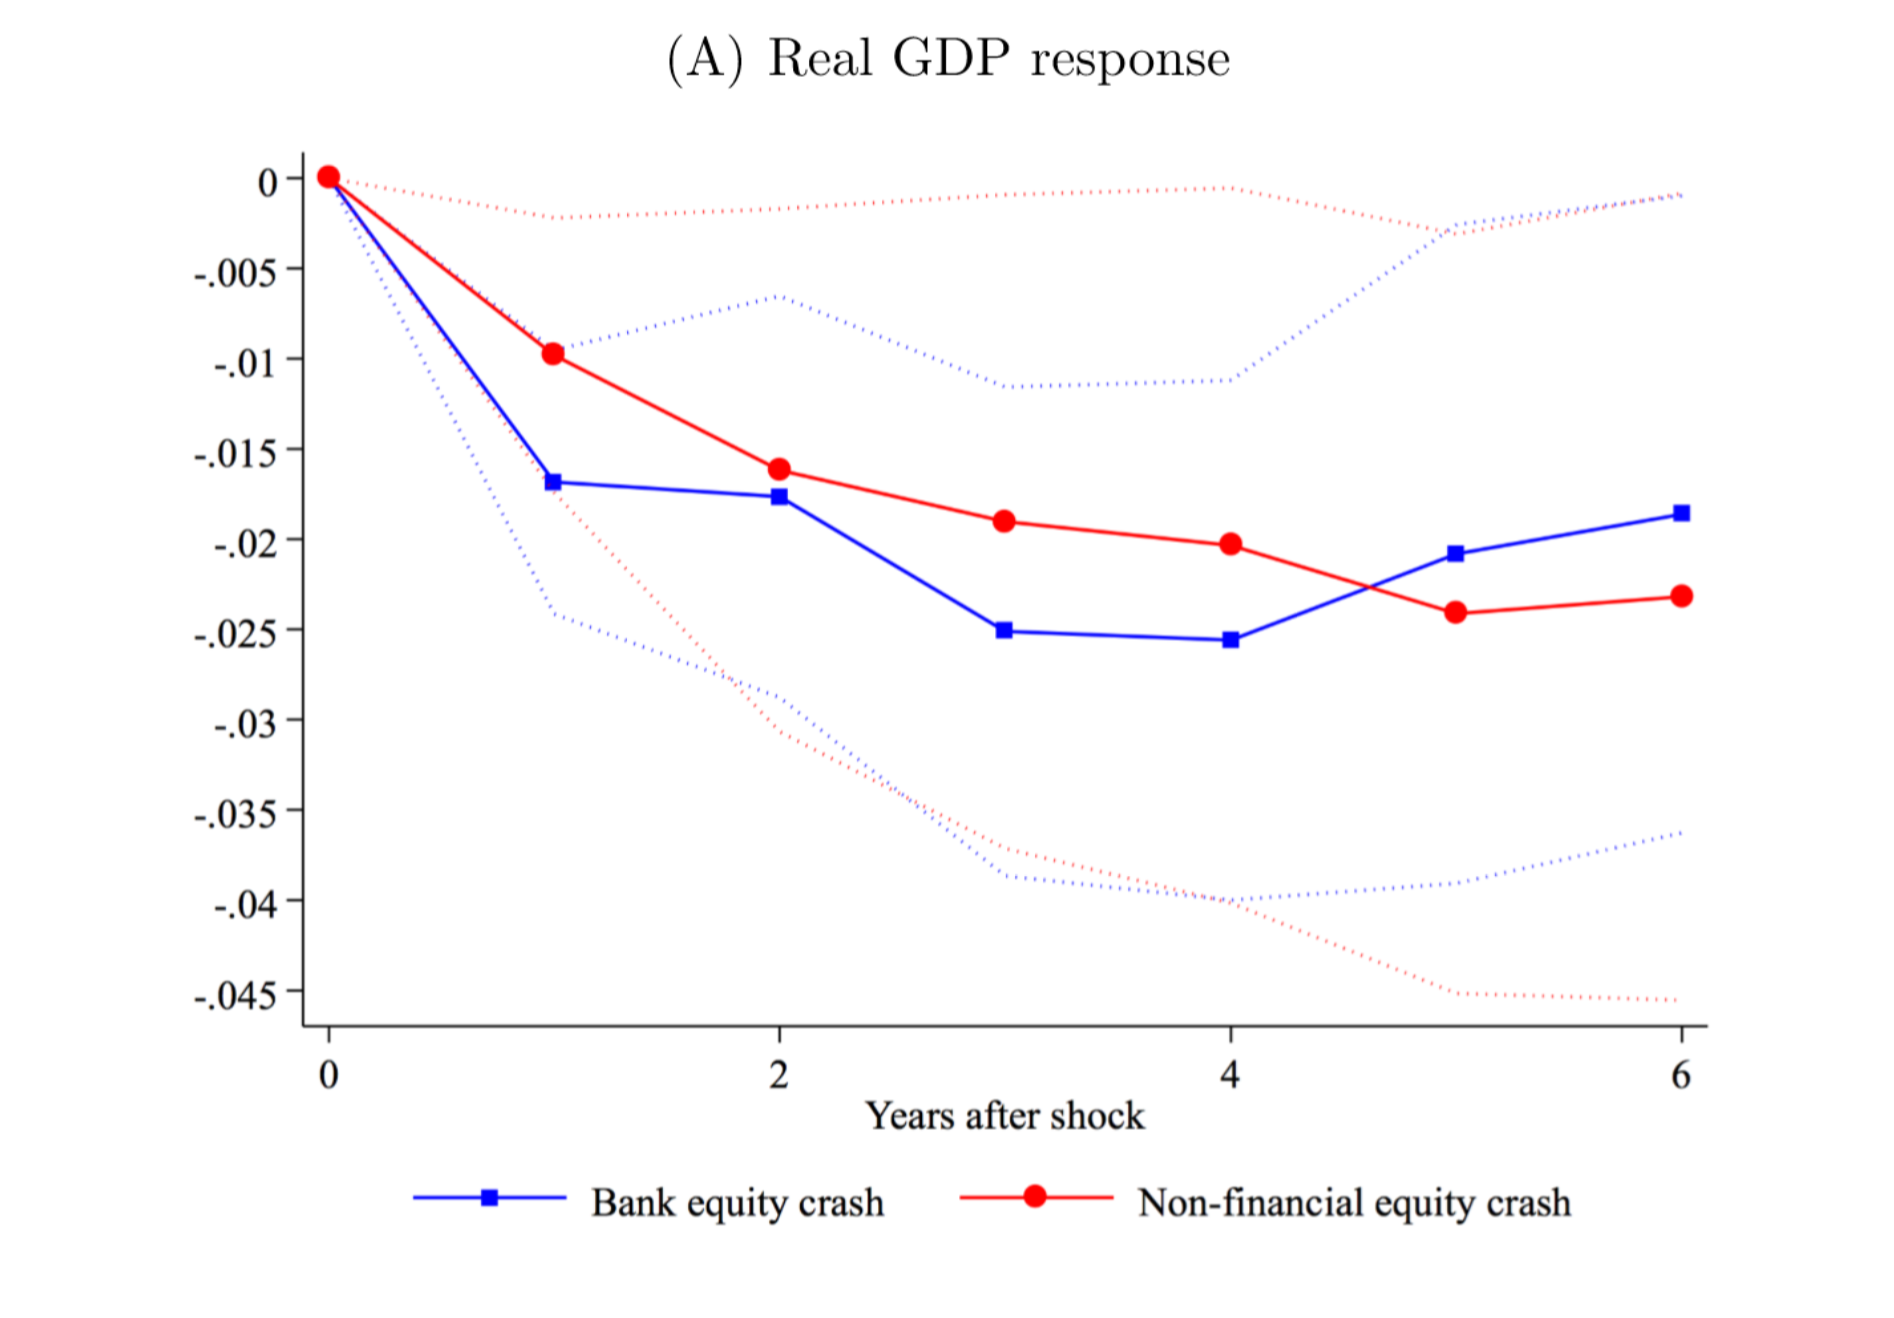
Utilizing their newly built database, the researchers find that a large-scale decline in market value of bank equity is an effective predictor of persistently lower subsequent output. They classified a bank equity crash as a 30% decline in real return in a year. Their estimation, as shown below by the blue line, suggests that a decline in bank equity of at least 30% predicts 2.5% lower output after three years.
The real GDP response of bank equity crash is controlled with the non-financial equity returns. As you can see from the figure above, a non-financial equity crash (red line) also, separately, predicts significant and persistently lower real output, and the magnitude is similar to the impact of a bank equity crash.
What distinguishes between the effect of the bank and non-financial equity crash is that the banking crisis seems to impact the real economy through the so-called bank lending channel. That is, a significant downfall in bank equity hampered the banks’ willingness or ability to make loans, which in turn drag down the economic growth.
The study suggests that the difficulties facing the banking sector usually dampen its lending function. A 30% bank equity decline predicts sharp and persistent contractions in bank credit to the private sector — three years after a bank equity decline, bank credit-to-GDP declines by 5.4%, relative to periods without a decline.
As you can see from the figure above, a crash in non-financial equity (red line) has essentially no effect on future credit-to-GDP.
This why bank equity should be considered as a useful indicator, as bank equity declines can capture shocks to bank net wealth, which translate into a credit supply contraction that depresses household consumption, corporate investment, and output.
Another reason that significant bank equity decline is a good leading indicator of an economic crisis is that, even if the banking stock crash is not followed by a “panic” situation, it can still predict economic slowdown.
Here the researchers define a “panic” as an episode containing any of the following narrative criteria: 1) widespread sudden depositor or creditor withdrawals at several of a country’s largest banks, large enough to threaten these banks’ ability to stay open; 2) severe and sudden strains in interbank lending markets; or 3) severe and sudden foreign-currency capital outflows from the banking sector.
Bank equity crashes can happen without “panic” when there are strong regulatory forbearance and implicit government guarantees to creditors to forestall panics. Examples the authors emphasized are the early stages of Japan’s 1990s financial crisis, and the Italian banks’ failures in the last few years.
As you can see from the figure above, for the first two years after a 30% loss in bank equity, the real GDP declines at a similar rate no matter it is followed by a panic episode or not. While a bank equity crash with panic situation resulted in a lower real GDP, but the decline in real GDP for non-panic bank equity crash is still very persistent, and can’t fully recover even 6 years after the crash.
The researchers also discovered that bank equity is an effective early indicator of economic crisis. In general, they found that a 30% fall in banking equity usually happens earlier than the 30% fall in non-financial stocks or a 1% rise in credit spread of banks.
A case in point is the 2008 financial crisis. As shown in the graph above, bank equity index (red line) recorded a 30% crash before the non-financial equity index and various interest rate spread showed signs of worry.
EconReporter is an independent journalism project striving to provide top-notch coverage on everything related to economics and the global economy.
💡 Follow us on Bluesky and Substack for our latest updates.💡


